
Students are leaving, but the money is not
The State of Rhode Island is poised to spend more money than ever before to educate fewer students than anytime in the 21st century. Gov. Dan McKee’s proposed state budget, still to be …
This item is available in full to subscribers.
Please log in to continue |
Register to post eventsIf you'd like to post an event to our calendar, you can create a free account by clicking here. Note that free accounts do not have access to our subscriber-only content. |
Day pass subscribers
Are you a day pass subscriber who needs to log in? Click here to continue.
Students are leaving, but the money is not


The State of Rhode Island is poised to spend more money than ever before to educate fewer students than anytime in the 21st century. Gov. Dan McKee’s proposed state budget, still to be scrutinized by the General Assembly, would spend $1.174 billion on public education — an increase of $57.8 million from the current year.
If approved, that money will go to 36 school districts plus dozens of charter schools, which are collectively educating fewer students than anytime in memory.
Public school enrollment has been on a long-term decline for about two decades, according to data compiled every year by the Rhode Island Department of Education. At the turn of the century, Rhode Island had 157,355 public school students. It reached a high point in the fall of 2003, when there were more than 159,000 students in public schools.
But public school enrollment began to decline precipitously in 2004, and Rhode Island lost more than 15,000 students in the next five years. A period of stability followed, with the state’s public school population hovering around 142,000 for about a decade, but it began dropping once again with the arrival of a global pandemic. Public school populations have decreased in the past three years, and in October of 2022, reported enrollment was 137,452 — a decline of 13% since the high the high point of 2003, and 4% in the past decade.
However, there are subtexts to the story of declining enrollment. While there is a steady, overall decline in the number of students walking into Rhode Island public schools every day, there has been a significant shift in the type of public schools they enter.
In October of 2012, the state reported a total of 142,854 students enrolled in a public school of some kind. Most were in traditional school districts, with only 4,662, or 3.3%, enrolled in a charter school. For the unfamiliar, charter schools are public schools, funded by local and state taxpayers, but they operate independently of their home districts.
As of this fall, the total Rhode Island public school population had shrunk to 137,452 students, yet the charter school population had, relatively speaking, skyrocketed, with 11,531 students now enrolled in charter schools. The group of students that once comprised just 3.3% of the total public school population in the 2012-2013 school year, has now grown to comprise 8.4% of the total public school population. So 1 in 12 of Rhode Island’s public school students walks into a charter school every day.
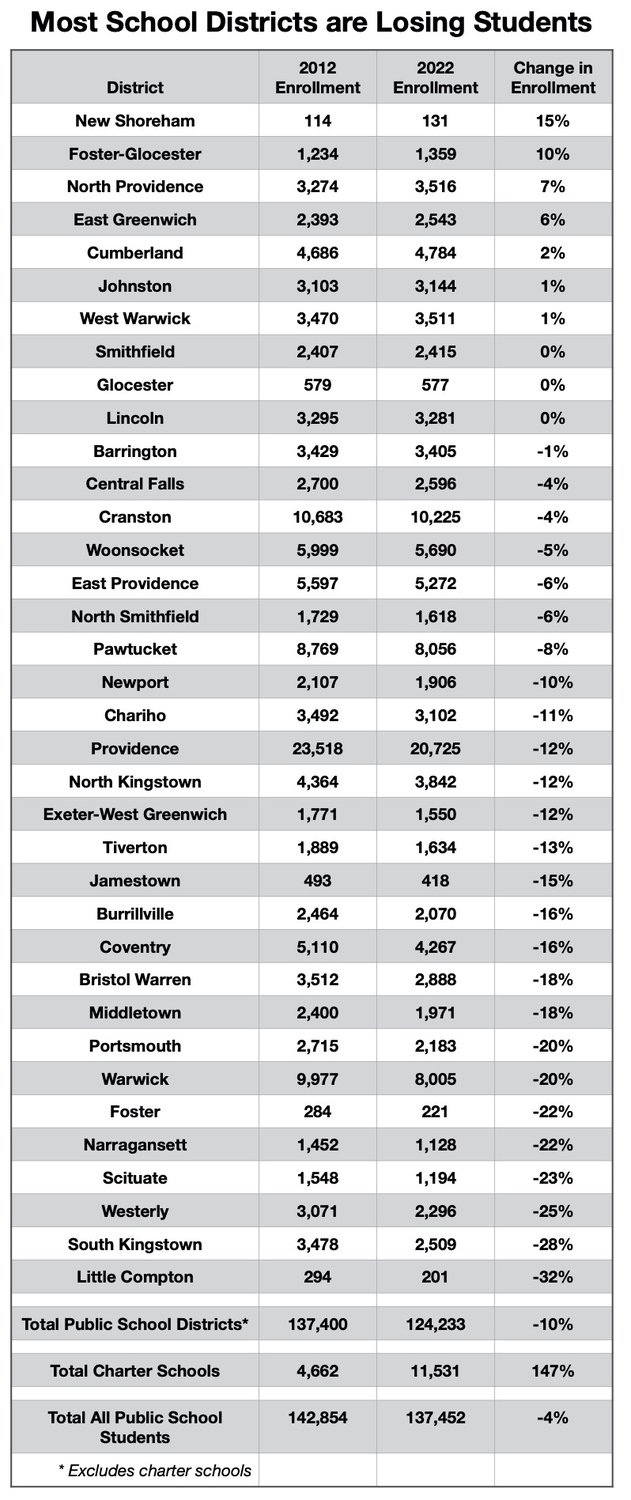
When factored together, the overall decline in public school enrollment and the major shift into charter schools are having an oversized impact on financing for traditional public school districts. As the chart here shows, the population of students in the traditional, core districts has shrunk 10%.
Money, money, money
The enrollment trends are bad news for public school districts, and the state, for a multitude of reasons. First, unless they can shut down entire classrooms, or even schools, districts cannot react quickly to declining enrollment. The population losses are often spread across the spectrum of grades, so it’s difficult to lose three students per grade and identify which teachers to cut, if any.
Secondly, because they receive state aid based on how many students attend their schools, districts take a step back in the “State Aid to Education Funding Formula” every time their enrollment declines. To make matters worse, they not only lose head count for every student who leaves their district to enroll in a charter school, they also have to pay that student’s tuition in the charter school.
The declining student populations are impacting more than two-thirds of Rhode Island’s districts. As seen in the accompanying chart, only a handful have seen any population growth in the past decade. Setting aside New Shoreman (Block Island) because its small numbers always make it an anomaly, only Foster-Glocester, North Providence, East Greenwich and Cumberland have grown more than 1% in the past 10 years.
Another group of six school districts have maintained their same population for the past decade. That group includes Barrington, which has nearly the same number of students this year as it had back in 2012.
The remaining 25 school districts have all experienced significant losses in student population, ranging from East Providence at 6%, to Portsmouth at 20% and Little Compton at 32%.
Though it is not the only factor, student enrollment is the driving factor in the state education aid formula. Thus, fewer students often leads to less state aid. Unless districts lower their expenses, then the funding burden almost always falls on local property taxpayers.
The state formula
The State Aid to Education Funding Formula is complex, and few people truly understand the drivers that determine which towns get what. A 30-page reference guide published several years ago by RIDE breaks the formula down into its key components.
The formula is based on the principle that the money follows the student (which is why sending districts pay charter schools). The state first establishes a core amount of money for each student. That amount is multiplied by the number of enrolled students to form the foundation of each district’s money.
The next key metric is the “Student Success Factor,” a measurement of the high-cost student needs within each district. Factors include students enrolled in Alternative Learning programs, GED programs, Outplacement programs or adult Transition programs.
The first half of the funding formula works like this:
- The “Core Amount” (a universal amount of money for every district) is multiplied by the number of enrolled Pre-K to 12 students);
- Districts then get a 40% increase to the “Core Amount” base for those students considered high-needs;
- Those two figures are added together to get the “Total Foundation.”
The final component of the formula is known as the “State Share Ratio.” This is unique to every district, based on measurements of a community’s ability to provide financial support to its schools. The formula calculates community property values, adjusted median family income and more factors that measure poverty and family need.
The “Total Foundation” aid cited above is multiplied by each district’s “State Share Ratio” to produce the final level of aid. By using this data-driven formula, Rhode Island tries to stay away from the funding anomalies of a generation ago, when Statehouse relationships, political sway and legislative deal-making may have influenced who go what.
These days, a mathematical computation determines who gets what.
Throwing money at it
While the Funding Formula is a pure mathematical calculation, the amount of money in the pot is subjective. This year, Gov. McKee is proposing to pour another $57.8 million into the pot.
Specifically, his proposal would send more money to schools with high-need students, by raising the “Student Success Factor” from a 40% multiplier to a 42% multiplier.
The governor has also suggested more support to school districts serving children who are homeless, and a lot more money ($13.1 million) for districts educating multilingual students and high-cost special education students.
Lastly, the governor has targeted more money for the districts that are simply losing students, putting short-term financial Band-Aids on the declining enrollment trends. Districts that lose students to charter schools would still receive 60% of the state aid for that student in the first year the student leaves the district and 30% of the state aid in year two, before the money goes away entirely in year three.
There are many reasons why one district gets more money than another. As shown repeatedly, population is the foundational piece. Districts that are losing students are likely losing state aid, too.
The next biggest factor is a community’s economic profile. The less affluent districts receive more funding, and districts with relative wealth and high family incomes receive less.
Then there are a range of smaller influences. Districts with students in “high-cost” special education programs get bumps in state aid. Those hosting high quality, in-house Pre-K programs get bumps. Those with regional busing programs get a bump.
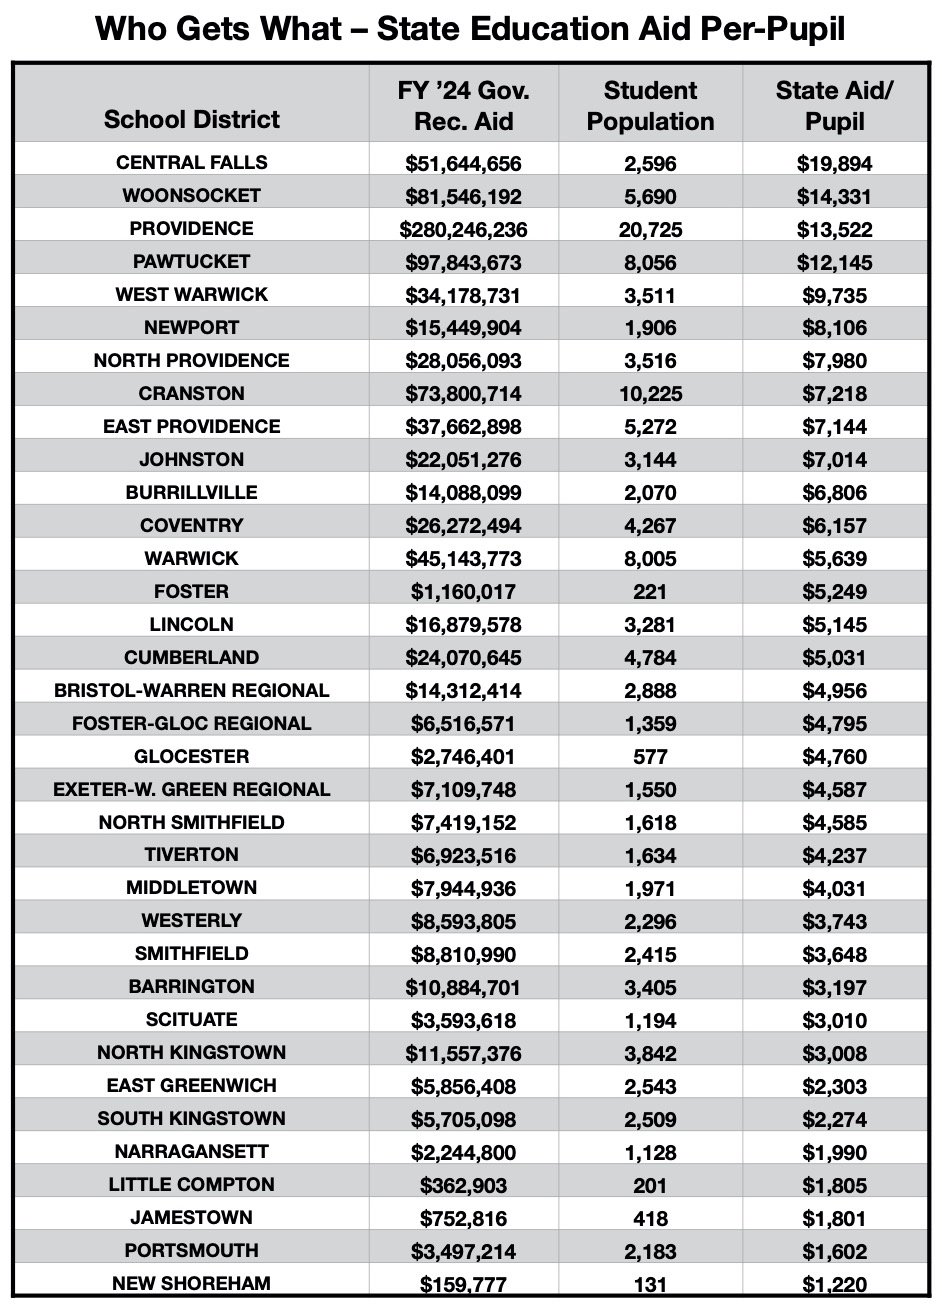
The charts below and above show how the proposed state aid breaks down, community by community, when student population is considered. Not surprisingly, Central Falls and Woonsocket receive the most state-aid-per-student. Little Compton, Jamestown and Portsmouth receive the least.
|
|
|
|
|
New Shoreham |
114 |
131 |
15% |
|
Foster-Glocester |
1,234 |
1,359 |
10% |
|
North Providence |
3,274 |
3,516 |
7% |
|
East Greenwich |
2,393 |
2,543 |
6% |
|
Cumberland |
4,686 |
4,784 |
2% |
|
Johnston |
3,103 |
3,144 |
1% |
|
West Warwick |
3,470 |
3,511 |
1% |
|
Smithfield |
2,407 |
2,415 |
0% |
|
Glocester |
579 |
577 |
0% |
|
Lincoln |
3,295 |
3,281 |
0% |
|
Barrington |
3,429 |
3,405 |
-1% |
|
Central Falls |
2,700 |
2,596 |
-4% |
|
Cranston |
10,683 |
10,225 |
-4% |
|
Woonsocket |
5,999 |
5,690 |
-5% |
|
East Providence |
5,597 |
5,272 |
-6% |
|
North Smithfield |
1,729 |
1,618 |
-6% |
|
Pawtucket |
8,769 |
8,056 |
-8% |
|
Newport |
2,107 |
1,906 |
-10% |
|
Chariho |
3,492 |
3,102 |
-11% |
|
Providence |
23,518 |
20,725 |
-12% |
|
North Kingstown |
4,364 |
3,842 |
-12% |
|
Exeter-West Greenwich |
1,771 |
1,550 |
-12% |
|
Tiverton |
1,889 |
1,634 |
-13% |
|
Jamestown |
493 |
418 |
-15% |
|
Burrillville |
2,464 |
2,070 |
-16% |
|
Coventry |
5,110 |
4,267 |
-16% |
|
Bristol Warren |
3,512 |
2,888 |
-18% |
|
Middletown |
2,400 |
1,971 |
-18% |
|
Portsmouth |
2,715 |
2,183 |
-20% |
|
Warwick |
9,977 |
8,005 |
-20% |
|
Foster |
284 |
221 |
-22% |
|
Narragansett |
1,452 |
1,128 |
-22% |
|
Scituate |
1,548 |
1,194 |
-23% |
|
Westerly |
3,071 |
2,296 |
-25% |
|
South Kingstown |
3,478 |
2,509 |
-28% |
|
Little Compton |
294 |
201 |
-32% |
|
Total Public School Districts* |
137,400 |
124,233 |
-10% |
|
Total Charter Schools |
4,662 |
11,531 |
147% |
|
Total All Public School Students |
142,854 |
137,452 |
-4% |
Public school enrollment has declined in at least two-thirds of Rhode Island school districts over the past decade, with a majority experiencing declines of 10% or more in their student populations. Overall, the number of students attending school in one of the state’s traditional districts has declined 10%. Many students have shifted into charter schools, whose student populations have more than doubled. But overall, the state’s public school population has still declined by about 4%, or a little more than 5,000 students.
State Aid Per-Pupil
|
School District |
FY ’24 Gov. Rec. Aid |
Student Population |
State Aid/Pupil |
|
CENTRAL FALLS |
$51,644,656 |
2,596 |
$19,894 |
|
WOONSOCKET |
$81,546,192 |
5,690 |
$14,331 |
|
PROVIDENCE |
$280,246,236 |
20,725 |
$13,522 |
|
PAWTUCKET |
$97,843,673 |
8,056 |
$12,145 |
|
WEST WARWICK |
$34,178,731 |
3,511 |
$9,735 |
|
NEWPORT |
$15,449,904 |
1,906 |
$8,106 |
|
NORTH PROVIDENCE |
$28,056,093 |
3,516 |
$7,980 |
|
CRANSTON |
$73,800,714 |
10,225 |
$7,218 |
|
EAST PROVIDENCE |
$37,662,898 |
5,272 |
$7,144 |
|
JOHNSTON |
$22,051,276 |
3,144 |
$7,014 |
|
BURRILLVILLE |
$14,088,099 |
2,070 |
$6,806 |
|
COVENTRY |
$26,272,494 |
4,267 |
$6,157 |
|
WARWICK |
$45,143,773 |
8,005 |
$5,639 |
|
FOSTER |
$1,160,017 |
221 |
$5,249 |
|
LINCOLN |
$16,879,578 |
3,281 |
$5,145 |
|
CUMBERLAND |
$24,070,645 |
4,784 |
$5,031 |
|
BRISTOL-WARREN REGIONAL |
$14,312,414 |
2,888 |
$4,956 |
|
FOSTER-GLOC REGIONAL |
$6,516,571 |
1,359 |
$4,795 |
|
GLOCESTER |
$2,746,401 |
577 |
$4,760 |
|
EXETER-W. GREEN REGIONAL |
$7,109,748 |
1,550 |
$4,587 |
|
NORTH SMITHFIELD |
$7,419,152 |
1,618 |
$4,585 |
|
TIVERTON |
$6,923,516 |
1,634 |
$4,237 |
|
MIDDLETOWN |
$7,944,936 |
1,971 |
$4,031 |
|
WESTERLY |
$8,593,805 |
2,296 |
$3,743 |
|
SMITHFIELD |
$8,810,990 |
2,415 |
$3,648 |
|
BARRINGTON |
$10,884,701 |
3,405 |
$3,197 |
|
SCITUATE |
$3,593,618 |
1,194 |
$3,010 |
|
NORTH KINGSTOWN |
$11,557,376 |
3,842 |
$3,008 |
|
EAST GREENWICH |
$5,856,408 |
2,543 |
$2,303 |
|
SOUTH KINGSTOWN |
$5,705,098 |
2,509 |
$2,274 |
|
NARRAGANSETT |
$2,244,800 |
1,128 |
$1,990 |
|
LITTLE COMPTON |
$362,903 |
201 |
$1,805 |
|
JAMESTOWN |
$752,816 |
418 |
$1,801 |
|
PORTSMOUTH |
$3,497,214 |
2,183 |
$1,602 |
|
NEW SHOREHAM |
$159,777 |
131 |
$1,220 |
This chart shows Gov. Dan McKee’s proposed state aid to education for the 2023-2024 school year, broken down to “State Aid per Pupil.” The enrollment figures were reported to RIDE in October of 2022. It reveals the influence of community wealth and poverty metrics in the state aid formula, as urban districts like Central Falls, Woonsocket and Providence receive the most aid-per-student, and coastal districts like Narragansett, Little Compton, Jamestown, Portsmouth and Block Island receive the least.


