
Tax bills in R.I. — from top to bottom
The diverse communities of the East Bay have vastly different tax structures, from the highest average tax bill to one of the lowest
As most municipalities begin their annual budgeting cycles in earnest, we took time to analyze the tax burdens in all Rhode Island cities and towns. Using public data from the Rhode Island Division …
This item is available in full to subscribers.
Please log in to continue |
Register to post eventsIf you'd like to post an event to our calendar, you can create a free account by clicking here. Note that free accounts do not have access to our subscriber-only content. |
Day pass subscribers
Are you a day pass subscriber who needs to log in? Click here to continue.
Tax bills in R.I. — from top to bottom
The diverse communities of the East Bay have vastly different tax structures, from the highest average tax bill to one of the lowest

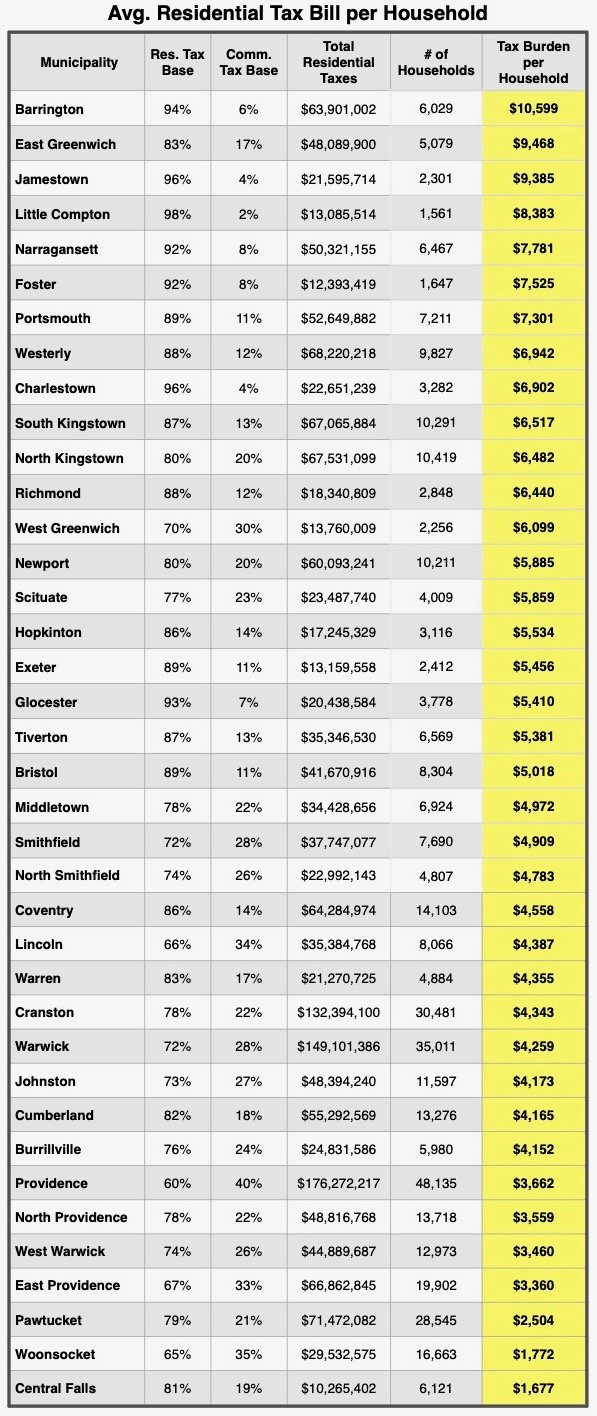

As most municipalities begin their annual budgeting cycles in earnest, we took time to analyze the tax burdens in all Rhode Island cities and towns. Using public data from the Rhode Island Division of Taxation, we studied residential and commercial tax levies, and incorporated the populations and number of households in each community.
The results were not totally surprising — Barrington has the highest average household tax burden in the state — but they were revealing.
There are two key drivers of the household tax burden. The first is how much each municipality spends on public services — schools, public works, parks, etc. The second is who pays the bills.
In communities with a balance between residential and commercial properties — East Greenwich and North Kingstown are examples — the broad business sectors soak up much of the tax burdens. Both of those communities are close to an 80/20 split between residential and commercial.
Of course, there are tradeoffs. Barrington and Little Compton have some of the least diverse tax structures, with residential properties filling the vast majority of the developed land in those towns, but they also enjoy beautiful neighborhoods, waterfront vistas, and don’t have a Quonset Business Park or rail line rolling through the middle of town.
Below are snapshots of each community in the East Bay, showing where they rank in terms of tax base diversity and average household tax burden.
Barrington
Barrington residents support the highest average household tax burden in the state. The driving factors are the town’s somewhat one-dimensional tax base (94% residential), as well as the large residential tax levy. Though the town has just the 24th-largest population in the state, it has the 10th-highest residential tax levy. The biggest reason is the town’s large student population — one of the densest student populations in the region (meaning, the number of students relative to the total population).
As has been the case for a couple of generations, families move there for the schools, and then pay hefty taxes to support them.
Bristol
Home to museums, parks and a bustling university, Bristol has a surprisingly low household tax burden. It has a somewhat diverse tax base (89% residential, 11% commercial), though that is just 10th among Rhode Island municipalities.
Two factors drive the town’s relatively low household tax burden. Its total residential tax levy is just $42 million (19th-highest in Rhode Island), and it has 8,300 residential properties. The result is an average household tax burden that is $5,018 per year — right in the middle of the pack, at 20th in Rhode Island.
East Providence
The residents of East Providence enjoy one of the lowest household tax burdens in Rhode Island for a variety of reasons. First, the city has an enormous commercial tax base — nearly $1.5 billion, or 33% of the city’s total tax base.
However, that tells only part of the story. Throughout the region, many municipalities levy the same tax rate on both residential and commercial properties. East Providence does not. The city has separate tax rates, and the commercial rate is about 23% higher than the residential rate.
When it comes time to actually levy taxes, the city’s residential tax burden is relatively modest. Despite having a population nearly three times the size of Barrington, East Providence’s residential tax levy is about the same ($67 million in E.P., compared to $64 million in Barrington).
With more than 19,000 households to split up that tax bill, East Providence has an average household tax burden of $3,360, one of the lowest in Rhode Island.
Little Compton
The little slice of heaven that is still home to working farms, fishing boats and multi-million-dollar estates has the least diverse tax base in Rhode Island (97% residential). That one-dimensional tax base, combined with the sparsely populated community (only 1,561 households), help Little Compton fall among the highest household tax burdens in the state.
Though the residential tax levy is only about $13 million per year (36th out of 39 cities and towns), the average tax burden per household is $8,383.
Middletown
Though largely considered a bedroom community outside of Newport, Middletown has a robust commercial district, representing 22% of the town’s total tax base. It also applies a much higher tax rate to those businesses, about a third higher than its residential tax rate.
Even though it has about 900 more households than a comparable town like Barrington, it relies much less heavily on tax revenues to support public services. The total municipal tax levy (residential and commercial combined) is just $48.5 million.
The result is an average household tax bill of just $4,972 per year — less than half of some of the top tax bills in the state.
Portsmouth
Portsmouth invites comparisons to Barrington. It is home to a highly regarded school system, as well as pockets of upper-class housing stock. However, it has a much broader commercial sector, including some large industry, creating a tax base that is 89% residential, 11% commercial.
Continuing the comparisons to Barrington, its annual tax levy is about $11 million lower ($53 million), and it has about 1,100 more households. The result is an average household tax burden that is seventh-highest in Rhode Island ($7,301), but is still 45% lower than Barrington’s.
Tiverton
When most outsiders think of Tiverton, they picture the rural vistas in South Tiverton, home to historic Tiverton Four Corners, the Seapowet region and working farms. Yet with the densely populated north end of town, a casino and some large industry close to Fall River, Tiverton has a surprisingly diverse tax base —13% commercial.
Its annual residential tax levy is about $35 million (15th-highest in Rhode Island), and its annual household tax burden ($5,381) falls right in the middle of the pack, 19th in the state.
Warren
The smallest town in the smallest county in the smallest state in America, also has one of the smallest household tax burdens. This is driven by a combination of factors.
First, Warren has a robust commercial sector that comprises 17% of the town’s tax base (WaterRower, TPI, Taylor Box, Jade Plastics, etc.). The town’s 4,900 households also support one of the least expensive bills for public services; the residential tax levy is just $22 million — about one-third of Barrington’s.
The result is an average household tax burden of $4,355 (27th out of 39 cities and towns in Rhode Island).


